Low-confidence bullish Japanese candlestick patterns
Bullish Japanese candlestick patterns with low confidence are a vital part of chart analysis tools in the world of trading and investment. These patterns provide a unique and detailed insight into trading activity in financial markets, reflecting price movements and enabling a deeper understanding of prevailing dynamics.
While bullish Japanese candlesticks indicate the possibility of price increases, low-confidence patterns are characterized by providing strong signals with a lower level of confirmation. This is due to their technical characteristics, which may make them less stable compared to higher-confidence patterns such as strong and confirmed patterns.
In this article, we will delve deeply into these patterns and their significance, providing a precise definition and exploring their various technical aspects. We will also discuss how to identify and interpret them on charts, enabling traders to effectively use them for informed trading decisions.
Furthermore, practical examples of applying these patterns in the real market will be provided to illustrate how they can be used practically and efficiently to enhance trading strategies and successfully achieve financial goals.
In summary, this article will serve as a comprehensive guide to low-confidence bullish Japanese candlestick patterns, offering readers a deep and practical understanding of how to use them in technical analysis and make investment decisions based on sound and thoughtful foundations.
فهرس المقالة
Low-confidence bullish patterns
● Belt Hold Bullish
● Hammer Bullish
● Harami Bullish
● Harami Cross Bullish
● Inverted Hammer Bullish
● Separating Lines Bullish
● Three Line Strike Bullish
1- Belt Hold Bullish:
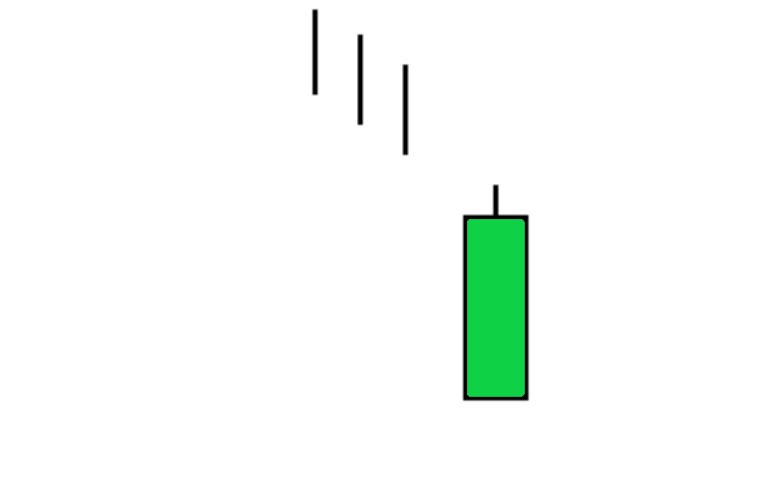
The Belt Hold Bullish pattern is a Japanese candlestick pattern considered a strong signal of a potential upward trend in the market. This pattern occurs during a previous downtrend and consists of only one candle, characterized by the following features:
- Appearance: The Belt Hold Bullish pattern typically appears near the bottom of a trading range, following a downtrend in the market.
- Candle Shape: The body (the colored part) of the single candle in this pattern is long and extends upwards, with no upper or lower shadow (a candle without wicks).
- Placement of the New Candle: The opening price of the new candle (the Belt candle) is near the low of the previous day, and prices move positively during the trading period, indicating strong buying support.
- Bullish Signal: This pattern serves as a strong signal for traders looking for a reversal from a downtrend to an uptrend. The long body of the Belt Bullish candle represents new demand entering the market, reflecting traders’ willingness to buy assets at lower prices.
- Confirmation of the Pattern: Confirmation of this pattern is strengthened if subsequent daily closings show continuation of the uptrend.
The Belt Hold Bullish pattern is highly regarded by technical traders as it offers an opportunity to enter long positions after confirmation of the pattern, often with a clear target based on the height of the Belt candle.
Overall, the Belt Hold Bullish pattern is a powerful addition to Japanese candlestick analysis tools, aiding in understanding market dynamics and making well-informed trading decisions.
Description of the Pattern:
The candle begins with an upward gap, where the opening price is higher than the previous closing price.
The candle is long-bodied and white (or green in colored candles), reflecting strong buying pressure.
The lower tail of the candle is small or nonexistent, indicating buyers’ control over the market without significant retracement.
This candle suggests that prices have shifted strongly from a downtrend to an uptrend, indicating the possibility of the uptrend continuing in the future.
Interpreting the Pattern:
In a down trending market context, a white-bodied candle appears where the opening price is lower than the lowest price during the trading session, indicating positive signals that may suggest improvement in buyers’ positions and the possibility of a trend reversal towards an upward direction.
2- Hammer Bullish:
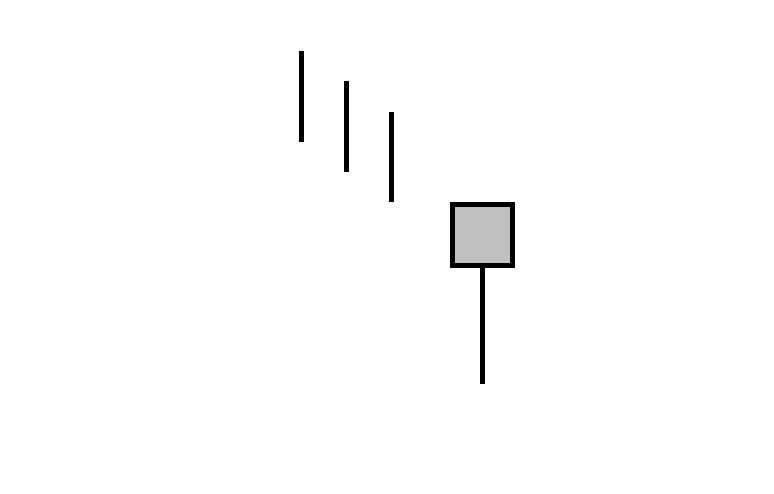
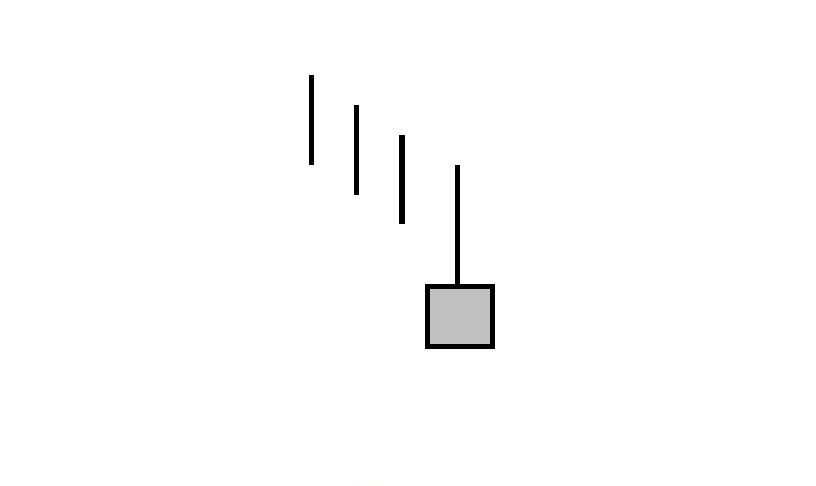
The Bullish Hammer pattern is a Japanese candlestick pattern that is considered a strong signal of a trend reversal from a downtrend to an uptrend. This pattern consists of one candle and is characterized by the following features:
- Appearance: The Bullish Hammer pattern appears at the end of a price decline and signifies the ability of buyers to regain control of the market after a period of selling pressure.
- Candle Shape: The candle in the Hammer pattern has a relatively small body and a long lower shadow that is at least twice the length of the body. The closing price should be near the day’s high, indicating buying strength that pushed the price to this support level.
- Candle Placement: It is preferable for the Bullish Hammer pattern to appear after a moderate price decline, with indications of strong technical support at the level where the candle appears.
- Bullish Signal: The Bullish Hammer pattern is highly positive as it shows that sellers were unable to push the price lower, and buyers regained control to push the price back up to the day’s highs.
- Confirmation of the Pattern: The Bullish Hammer pattern is typically confirmed when followed by subsequent candles in the following days that show continuation of the uptrend, increasing traders’ confidence in the bullish signal.
The Bullish Hammer pattern is considered a crucial tool in Japanese candlestick analysis, providing traders with a strong signal of potential upward opportunities when appearing in the market under appropriate conditions and context.
Pattern Description:
The candlestick describes a Japanese pattern known as “Hammer Bullish,” characterized by a small real body appearing at the upper end of a downtrend trading range, along with a lower shadow that is at least twice the length of the real body, typically with no upper shadow.
Pattern Interpretation:
This candlestick indicates strong selling pressure that halted after the market opened during a downtrend. When the market closes near the candle’s high by a small margin, it suggests the potential end of the downtrend (bottoming out). After confirming that the pattern indicates a bottom, a reversal confirmation can also occur with a higher open and close in the next session. This pattern resembles the “UMBRELLA (Doji Dragonfly)” pattern but is less reliable.
3- Harami Bullish:
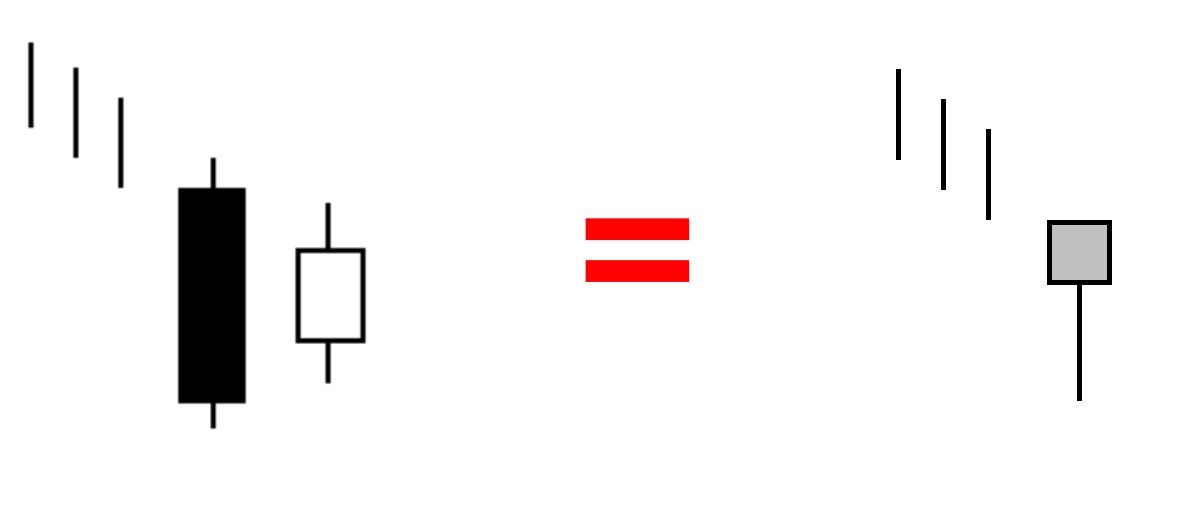
The Harami Bullish pattern in Japanese candlesticks indicates a potential reversal from a downtrend to an uptrend. This pattern consists of two candles, where the second candle is small and located within the range of the first candle, with the color of the second candle typically being white or green.
To better understand this pattern, here is a detailed explanation of its components and interpretation:
First Candle (Large Candle):
- The first candle in the Harami Bullish pattern is large and usually red or black in color.
- The large candle represents a significant price movement in a downward direction, indicating strong selling pressure.
Second Candle (Small Candle):
- The second candle is a small candle that is white or green.
- The second candle appears within the range of the first candle, meaning the closing and opening prices of the second candle are within the body (colored part) of the first candle.
Pattern Interpretation:
- The Harami Bullish pattern is interpreted as a signal for the market to potentially reverse from a downtrend to an uptrend.
- The small candle inside the large range of the previous candle indicates a decrease in selling pressure and the ability of buyers to gain control.
- A price breakout to the upside in subsequent sessions confirms the potential continuation of the uptrend.
Pattern Confirmation:
The Harami Bullish pattern can be strengthened by additional confirmations such as follow-up bullish candles, which confirm the continuity of the potential uptrend.
Trading Strategies:
- The Harami Bullish pattern can be used as a signal to initiate buying positions upon confirming a trend reversal.
- It is advisable to use this pattern within a technical context supported by strong technical support or resistance that has been tested.
In this way, the Harami Bullish pattern is considered a powerful tool in Japanese candlestick analysis, aiding in identifying trend changes and the market’s readiness for an upward reversal after a period of selling pressure.
Pattern Description:
The appearance of a long black candle in a downtrend, where the second candle is a white candle that completely engulfs the body of the black candle, is referred to as being in a Harami Position.
Pattern Explanation:
Following the appearance of a long black candle in a downtrend, if the white candle opens above the close of the black candle, it indicates that buying pressure has pushed the price higher. This pattern should be confirmed by the next trading day that shows continuation of the uptrend. These initial two days form part of the Inside Three pattern.
4- Harami Cross Bullish:
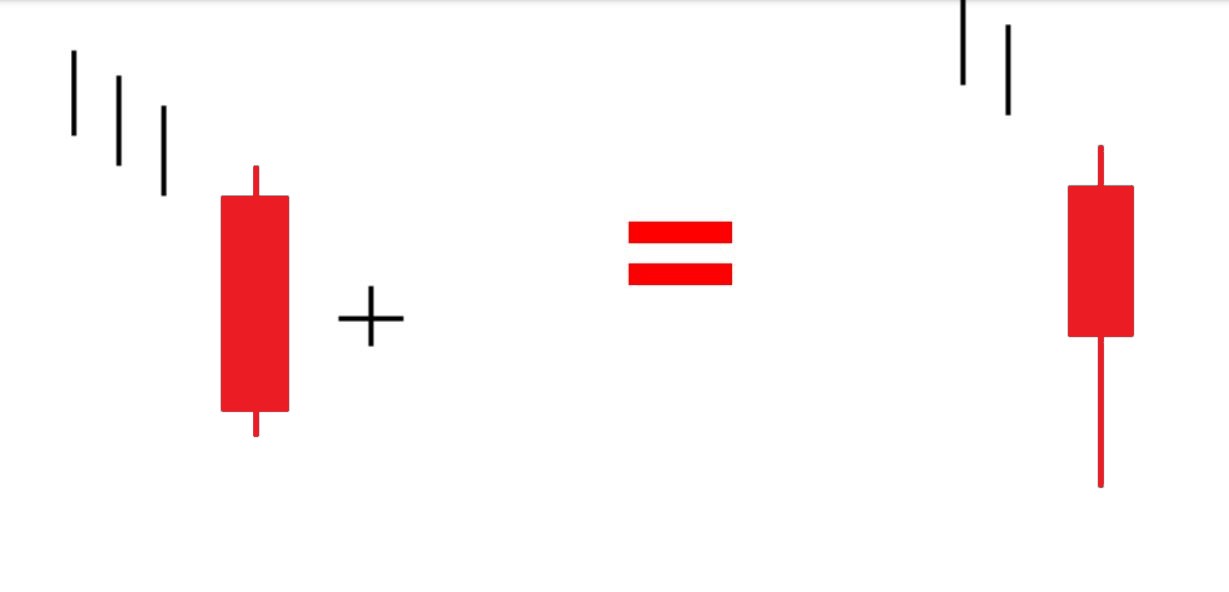
Harami Cross Bullish Pattern** in Japanese candlesticks is a strong signal indicating a reversal from a downtrend to an uptrend. This pattern consists of two candles, where the first candle is large and typically red or black.
Full Description of the Pattern:
First Candle (Large Candle):
- The first candle in the Harami Cross Bullish pattern is large and usually red or black.
- It represents a significant price movement in a downward direction, indicating strong selling pressure.
Second Candle (Small Candle):
- The second candle is a small candle that appears within the range of the first candle.
- There is a cross between the opening and closing prices of the second candle with respect to the first candle, meaning the opening and closing prices of the second candle are approximately at the same price level within the first candle.
Pattern Interpretation:
- The Harami Cross Bullish pattern is interpreted as a positive signal for a change in direction from bearish to bullish.
- The small candle inside the range of the preceding large candle suggests a reduction in selling pressure and the potential for buyers to regain control.
- The small candle may indicate absorption of selling pressure and the beginning of a bullish reversal.
Pattern Confirmation:
- The Harami Cross Bullish pattern is confirmed by the next trading day that shows potential continuation of the uptrend.
- This pattern marks a strong beginning for a bullish reversal and may be followed by more bullish candles to reinforce the signal.
Trading Strategies:
- The Harami Cross Bullish pattern can be used as a signal to initiate buying positions upon confirmation of a trend reversal.
- It is preferable to use this pattern in a technical context supported by strong technical support or tested resistance.
In this manner, the Harami Cross Bullish pattern is considered an important tool in Japanese candlestick analysis, helping traders identify potential trend changes and prepare to execute strategic trades based on the resulting signals.
Pattern Description:
The first candle appears as a long black candle, while the second candle forms as a Doji within the body of the first candle, thereby in the Harami position.
Pattern Explanation:
After the appearance of a long black candle in a downtrend, if the white candle opens above the close of the black candle and closes at the same opening price, this pattern is considered more confirmatory than the regular Harami pattern. It indicates a bullish reversal for buyers (bulls).
5- Inverted Hammer Bullish:
Inverted Hammer Bullish Pattern in Japanese Candlesticks
The Inverted Hammer Bullish pattern in Japanese candlesticks is considered a strong signal for a trend reversal from bearish to bullish. This pattern consists of a single candlestick with a distinct appearance in the chart as follows:
Candle Shape:
- The candlestick has a long lower shadow that is at least twice the length of the body.
- The body of the candlestick is relatively small and located at the top, extending downwards towards the day’s low price.
Pattern Location:
The Inverted Hammer Bullish pattern typically appears at the bottom of a downtrend, indicating weakness among sellers in pushing the price to lower levels.
Pattern Explanation:
- The long lower shadow of the candle reflects a decline in price to new lows, but the small body suggests a recovery by the end of the session.
- The candle is interpreted as buyers managing to significantly push the price higher from the low point, indicating potential buying strength.
Utility of the Pattern and Its Use:
- The Inverted Hammer Bullish pattern is used as a strong buy signal when it appears at the end of a downtrend, enhancing the likelihood of a market reversal to the upside.
- This pattern is effective in identifying potential entry points for traders seeking a change in price direction.
Trading Strategy:
- A trading strategy using the Inverted Hammer Bullish pattern may involve entering buy positions when the next candle confirms a rise above the high of the previous candle.
- It is preferable to confirm the pattern with additional bullish candles in subsequent sessions to strengthen the signal.
In this way, the Inverted Hammer Bullish pattern is a powerful tool in Japanese candlestick analysis for trading, helping traders identify potential entry points and prepare for bullish reversals in financial markets.
Pattern Description:
A small candle with a real body appears at the bottom of a downtrend range, accompanied by an upper shadow not exceeding twice the length of the real body. Typically, there is no lower shadow.
Pattern Explanation:
In a downtrend, the market opens below the close of the previous candle. Buyers then push the price higher, but they fail to close it above the previous candle’s close entirely. This pattern suggests a potential bullish reversal in the near future, with confirmation of the reversal occurring when the price opens and closes above the body of the Inverted Hammer candle on the next trading day. This pattern resembles the Doji Gravestone (UMBRELLA INVERTED) pattern but is considered less reliable.
6- Separating Lines Bullish:
The Bullish Separating Lines pattern in Japanese candlesticks is considered a strong signal for continuation in the upward trend. This pattern consists of two candles and is characterized by clear specifications typically defined as follows:
Pattern Description:
- The Bullish Separating Lines pattern in Japanese candlesticks is considered a strong signal for continuation in an upward trend.
- This pattern consists of two candles, characterized by clear specifications usually defined as follows:
Candle Shapes:
- First Candle: It is a large black or red-bodied candle.
- Second Candle: It is a white or green-bodied candle that opens at the closing price of the previous candle and closes at or above the high price of the first candle.
Pattern Specifications:
- The second white candle opens at the closing price of the first black candle.
- The second candle should close at a higher price or at least slightly above the high of the first black candle.
- The second candle may be slightly taller than the first candle, but it is not mandatory.
Pattern Benefit:
- The Bullish Separating Lines pattern is considered a strong signal for continuation in an upward trend following a period of decline.
- It demonstrates buying strength as the price surpasses the previous high of the black candle, enhancing the likelihood of further upward movement.
Trading Strategy:
- Entering Long Trades: Traders can enter buy trades when the second candle confirms closing above the first black candle.
- Setting Profit Targets: Profit targets can be set at nearby resistance levels or continuation of the upward trend.
- Setting Stop Loss: A stop loss should be placed close to the low of the first black candle to minimize risks in case of a market reversal.
In this way, the Bullish Separating Lines pattern is one of the important patterns in Japanese candlestick analysis, helping to identify opportunities for continuation in the upward trend and effectively plan trading operations.
Pattern Description:
The first candle is a black candle, and the second candle is a white candle that opens at the same price as the opening of the first candle.
Pattern Explanation:
In an upward trading trend, a long black candle appears followed by a white candle that starts where the first candle’s trading ended and rises to close higher. This indicates that the upward trading trend is likely to continue.
7- Three Line Strike Bullish:
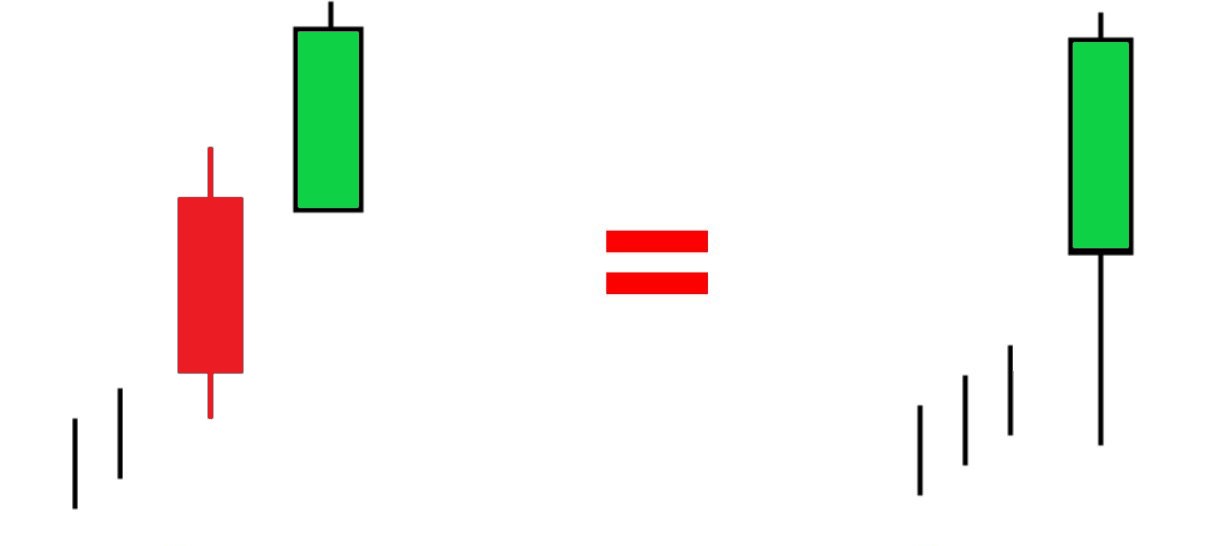
The Bullish Three Line Strike pattern in Japanese candlesticks is considered a strong signal of a reversal from bearish to bullish. This pattern consists of four candles, where the first candle is a bearish candle followed by three bullish candles. Here is a detailed explanation of this pattern:
First Candle (Bearish Candle):
- The first candle is a large bearish candle.
- This candle represents a strong downward movement in price and selling pressure.
Subsequent Three Candles (Bullish Candles):
- The following three candles are bullish candles.
- Each bullish candle should close above the previous candle, indicating continuity in the shift to an upward trend.
- These three bullish candles can have large or small bodies, but all signify buying strength and the ability to push prices higher.
Meaning of the Pattern:
- The Bullish Three Line Strike pattern is interpreted as a strong market reversal from bearish to bullish.
- It shows continuity in the positive turnaround and buying strength after a strong bearish period.
Trading Strategy:
- Entering Long Trades: Traders can enter buy trades when the third candle closes above the second candle.
- Setting Targets and Stop Loss: Profit targets can be set based on nearby resistance levels or continuation of the upward trend. Stop loss should be placed close to the lowest price of the first candle to minimize risks.
The Bullish Three Line Strike pattern is considered a strong signal in Japanese candlestick analysis, helping traders identify strong market reversals and prepare for positive trading opportunities effectively.
Description of the Pattern:
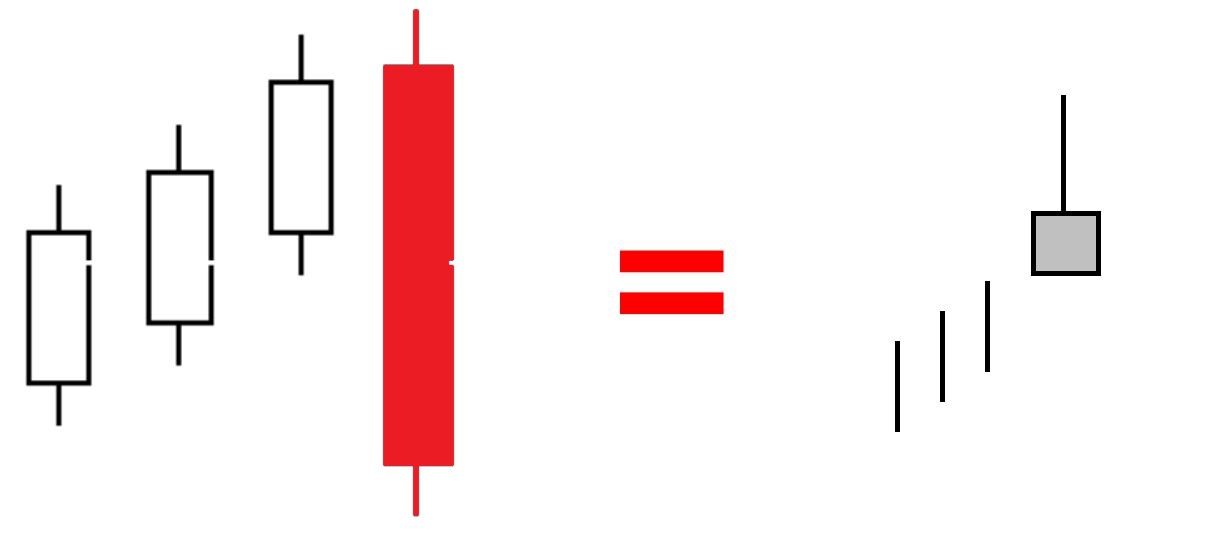
In an upward trading trend, three consecutive white candles with consecutive higher closes appear. The fourth candle opens above the last close of the third candle and closes below the open of the first candle.
Interpreting the Pattern:
If the black candle pushes prices downward, it retraces back to where it started at the beginning of the pattern. If the upward trend is strong prior to the pattern’s appearance, continued upward movement and reinforcement are expected.
In conclusion, the importance of bullish Japanese candlestick patterns with lower reliability as tools for market analysis and anticipating potential trends becomes evident. While these patterns may be less reliable compared to others, they provide crucial signals that warrant careful attention and analysis. With a deep understanding of market behavior and confirming these patterns with additional indicators, traders can leverage them for well-informed and optimized trading decisions.


