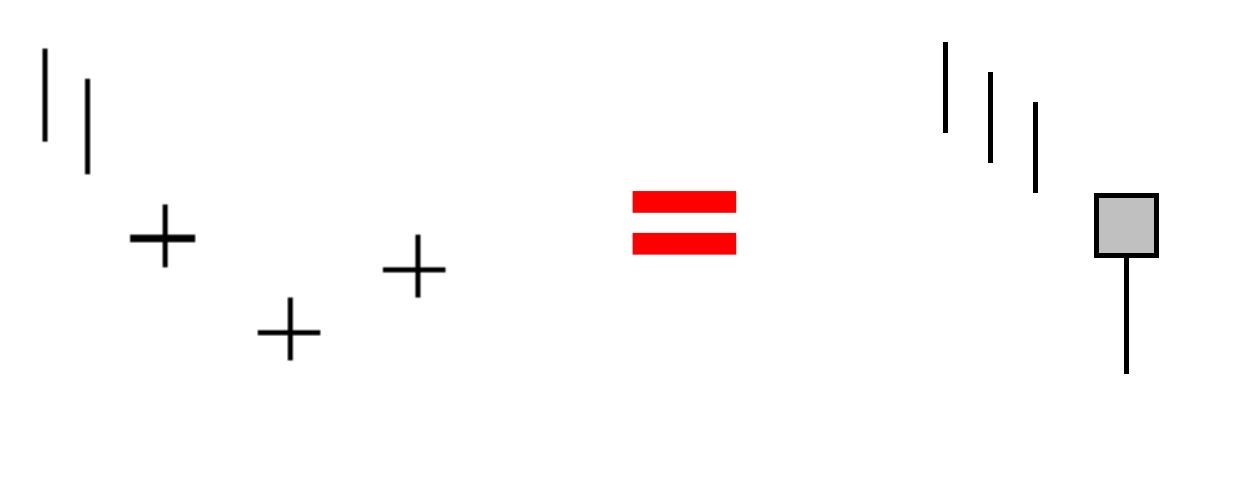
Japanese candles: Bullish patterns of moderate confidence

Bullish Japanese candlestick patterns of moderate confidence reflect instances where candles indicate a potential recovery or reversal in direction following a period of decline or consolidation. Although they carry less risk compared to high-confidence patterns, they still provide important signals for traders interested in identifying potential entry points and managing risks effectively.
In the world of technical analysis, Japanese candlesticks are powerful tools that help traders understand market dynamics more deeply. These patterns are known for their ability to provide signals about future price trends based on specific formations visible on the price chart. Among these patterns are the moderate-confidence bullish patterns, which are strong signals of the possibility of continued upward trends in financial markets.
This article will delve into a variety of moderate-confidence bullish patterns, explaining how each pattern forms, its characteristics, and how to use it in technical analysis. Practical examples of each pattern will be presented to illustrate their application in real markets, along with discussions on potential entry and exit strategies based on these signals.
Understanding these patterns and knowing how to use them correctly can significantly improve trading forecast accuracy and enhance success in financial markets.
فهرس المقالة
- 1 Moderate Confidence Bullish Japanese Candlestick Patterns:
- 1.1 1- Breakaway Bullish:
- 1.2 2- Engulfing Bullish:
- 1.3 3- Dragonfly Doji (UMBRELLA) Bullish:
- 1.4 4- Homing Pigeon Bullish:
- 1.5 5- Gravestone Doji (INVERTED UMBRELLA) Bullish:
- 1.6 6- Ladder Bottom Bullish:
- 1.7 7- Matching Low Bullish:
- 1.8 8- Meeting Lines Bullish:
- 1.9 9- Piercing Line Bullish:
- 1.10 10- Stick Sandwich Bullish:
- 1.11 11- Three Stars In The South Bullish:
- 1.12 12- Tri Star Bullish:
- 1.13 13- Unique Three River Bottom Bullish:
- 1.14 14- Doji Star Bullish:
- 1.15 15- Upside Gap Three Methods Bullish:
- 1.16 16- Upside Tasuk Gap Bullish:
- 2 Conclusion:
Moderate Confidence Bullish Japanese Candlestick Patterns:
● Breakaway Bullish
● Engulfing Bullish
● Dragonfly Doji (UMBRELLA) Bullish
● Homing Pigeon Bullish
● Gravestone Doji (INVERTED UMBRELLA) Bullish
● Ladder Bottom Bullish
● Matching Low Bullish
● Meeting Lines Bullish
● Piercing Line Bullish
● Stick Sandwich Bullish
● Three Stars In The South Bullish
● Tri Star Bullish
● Unique Three River Bottom Bullish
● Doji Star Bullish
Upside Gap Three Methods Bullish
● Upside Tasuk Gap Bullish
1- Breakaway Bullish:
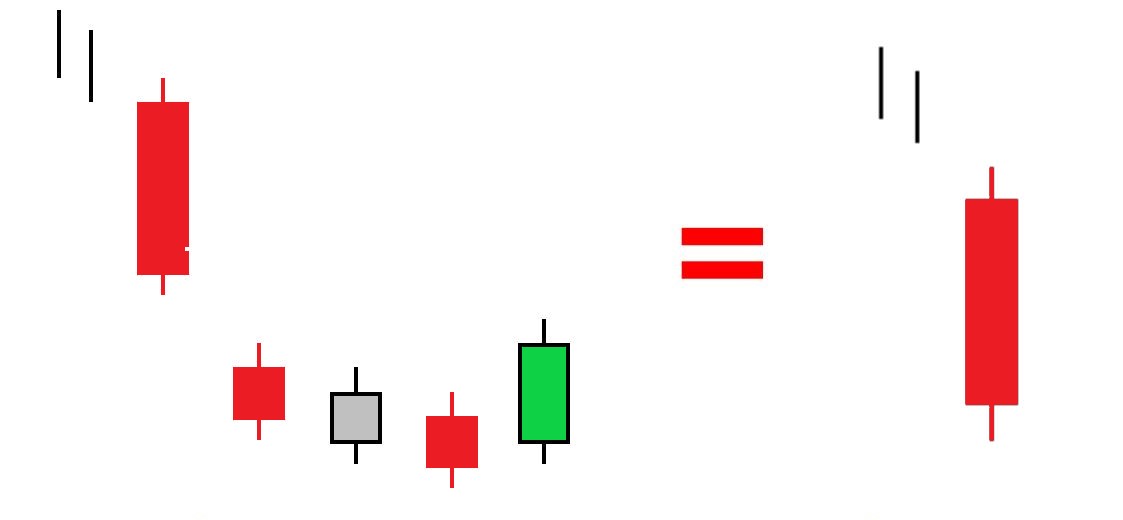
The “Breakaway Bullish” pattern is a Japanese candlestick pattern used in technical analysis to signal a potential uptrend after a period of decline or consolidation. This pattern is part of the bullish (expected to rise) category of patterns and is considered a strong signal when it appears in the market.
Pattern Structure:
- The “Breakaway Bullish” pattern consists of a series of Japanese candlesticks that follow a specific sequence.
- The pattern starts with a bearish candle (downward candle), followed by consecutive bullish candles (in reverse order), until the price breaks through a certain resistance level or downward trend.
Key Characteristics of the Breakaway Bullish Pattern:
- First Candle (Bearish Candle): The pattern begins with a strong downward candle, signaling seller dominance.
- Intermediate Candles (Bullish Candles): Following the bearish candle, a series of upward candles indicate a price recovery, where buyers regain control of the market.
- Last Candle (Breakout Candle): The primary signal is the final upward candle in the pattern, which surpasses a critical resistance level or trendline, indicating the potential continuation of the uptrend in prices.
Use of the Pattern:
- The “Breakaway Bullish” pattern is used by traders as a signal to enter long positions (buying), where the breakout of a pivotal resistance by the last candle serves as an effective indication of potential upward movement in the market.
- Confirmation of the pattern with additional technical analysis indicators such as trading volume and other technical indicators enhances the accuracy of the signal.
Practical Example:
Let’s assume the market was trading within a narrow range for several sessions, then the “Breakaway Bullish” pattern appeared, with a downward candle followed by a series of strong upward candles. In the next session, the price breaks through a key resistance level, confirming the possibility of continued upward movement.
In this way, the “Breakaway Bullish” pattern represents an important tool in technical analysis for traders, helping them identify strong buying opportunities and potential market trends with precision and effectiveness.
2- Engulfing Bullish:
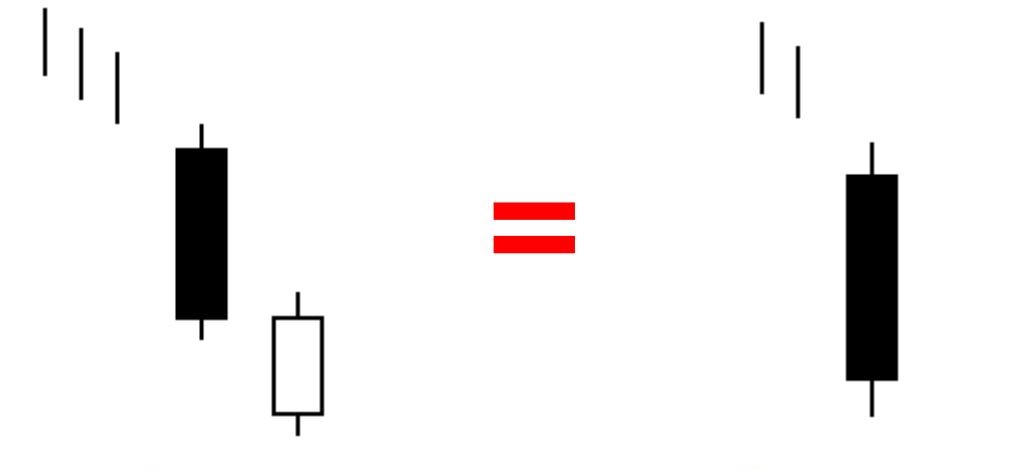
The “Engulfing Bullish” pattern is a Japanese candlestick pattern considered a strong bullish signal in technical analysis. This pattern occurs when a bullish candle (the second candle) completely engulfs the body of the preceding bearish candle (the first candle), indicating a strong shift from seller control to buyer control.
Pattern Structure:
The “Engulfing Bullish” pattern consists of the following elements:
- First Candle (Bearish Candle): This is a downward candle, signaling price weakness or the end of a previous uptrend.
- Second Candle (Bullish Engulfing Candle): This candle is much longer than the preceding bearish candle, closing above the high of the bearish candle and opening below its low. This reflects strong buying strength and domination over sellers.
Pattern Characteristics:
- The “Engulfing Bullish” pattern is considered a strong bullish signal when it appears after a period of price decline, indicating a significant shift in market sentiment from negative to positive.
- The pattern clearly demonstrates a change in dynamics between sellers and buyers, making it attractive to traders seeking strong entry signals.
Pattern Use:
- Traders use the “Engulfing Bullish” pattern to make buying (long) decisions. Entering the market after the close of the bullish engulfing candle is an effective strategy to capitalize on expected positive price movements.
- Confirmation of the pattern with other technical analysis indicators such as trading volume and relative strength indicators ensures signal accuracy.
Practical Example:
Imagine the market was trading in a narrow range for several sessions, then the “Engulfing Bullish” pattern appeared where the second bullish candle completely engulfed the first bearish candle and closed above it. This serves as a strong signal for traders to enter long positions, anticipating a rise in prices in the near future.
In this way, the “Engulfing Bullish” pattern is considered a powerful and effective tool in Japanese candlestick analysis, helping traders identify potential bullish opportunities in financial markets.
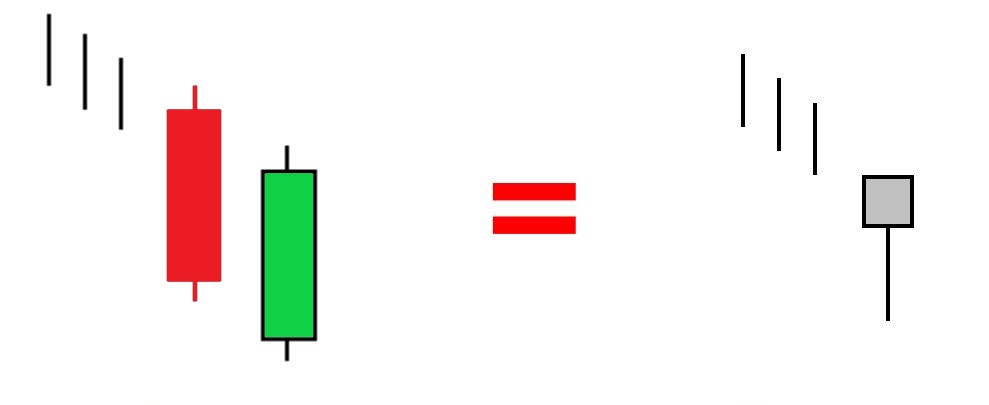
3- Dragonfly Doji (UMBRELLA) Bullish:
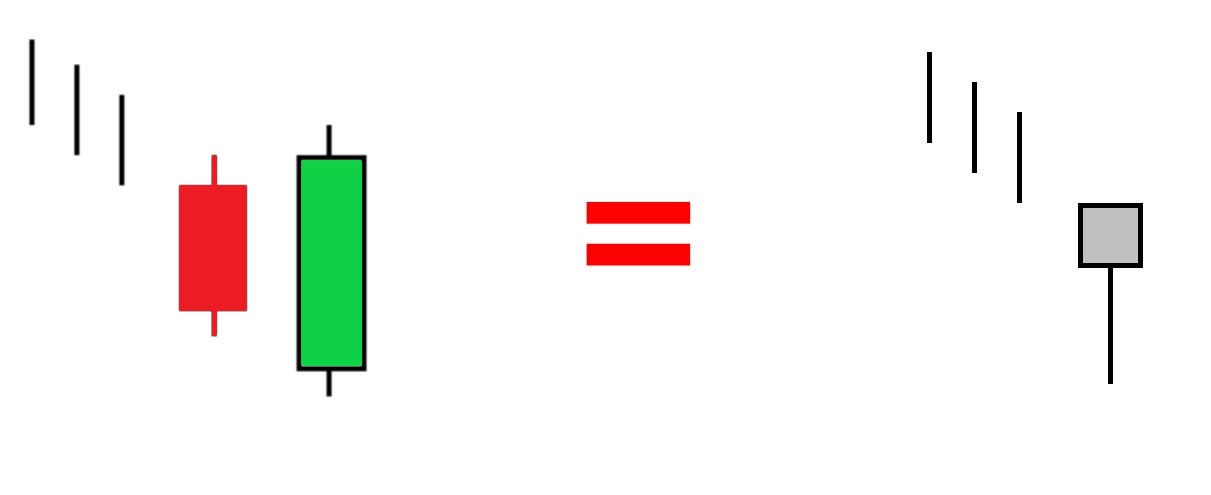
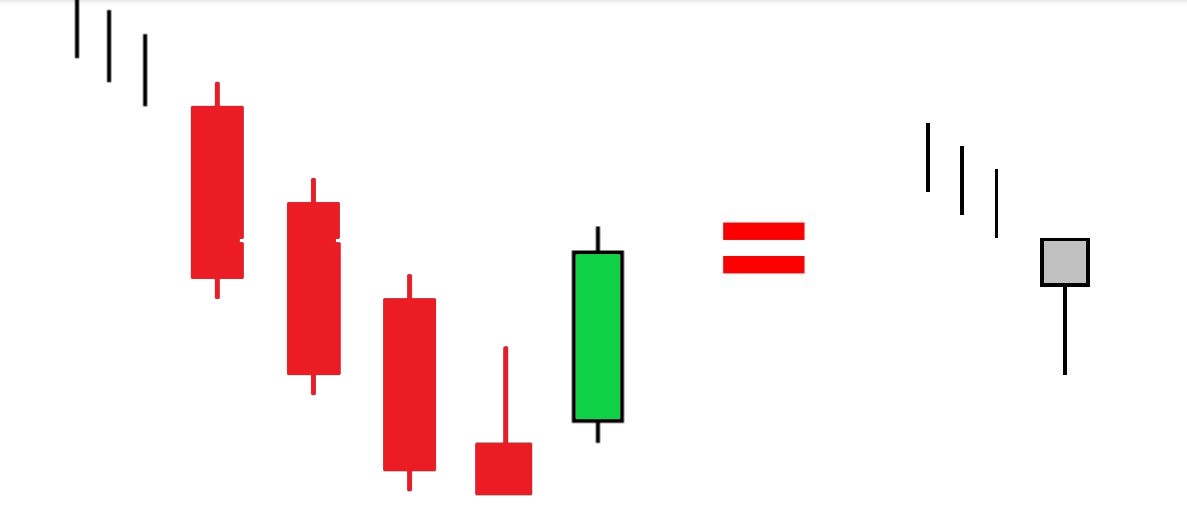
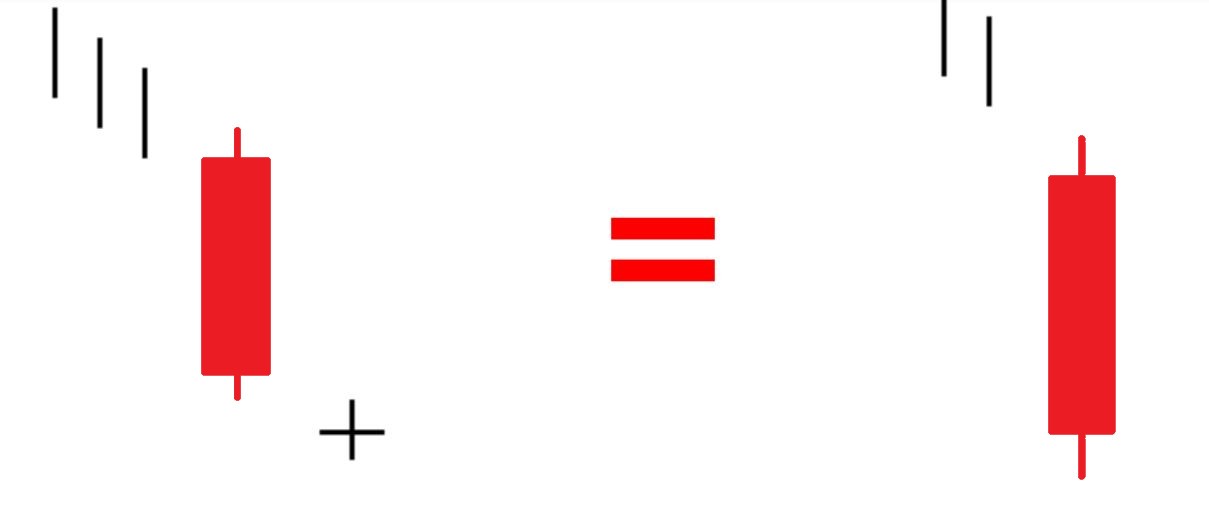
The “Dragonfly Doji,” also known as the “Umbrella Bullish,” is a Japanese candlestick pattern considered a strong bullish signal in technical analysis. This pattern is distinguished by its unique shape, indicating a balance between seller and buyer forces in the market, suggesting a potential change in price direction from downtrend to uptrend.
Pattern Structure:
The “Dragonfly Doji” pattern consists of the following elements:
- Body: The body is almost non-existent or very narrow, reflecting a balance between the opening and closing prices.
- Upper Shadow: This is long and extends above the body, indicating that the price moved significantly higher from the opening level during the session.
- No or Very Short Lower Shadow: There is either no lower shadow or it is very short, indicating minimal selling pressure at the session’s low.
Pattern Characteristics:
- The “Dragonfly Doji” signals a potential reversal from downtrend to uptrend, as the long upper shadow suggests successful buying pressure pushing the price to its high point during the period.
- This pattern signifies that buyers have regained control after a period of decline or consolidation, making it attractive to traders seeking to capitalize on potential upward movements in the market.
Pattern Use:
- Traders use the “Dragonfly Doji” as a signal to enter long positions (buying) once the next candle confirms the upward direction.
- Confirmation of the pattern with other technical indicators such as trading volume and relative strength indicators ensures signal accuracy.
Practical Example:
Suppose an asset price has been declining for some time, and a “Dragonfly Doji” pattern appears on the chart. If the next candle confirms the upward movement by closing above the previous candle’s high, it serves as a strong signal to buy with expectations of continued upward movement.
In this way, the “Dragonfly Doji” pattern is a powerful tool in the toolkit of technical analysis, helping traders identify positive opportunities in financial markets using advanced Japanese candlestick interpretations.
Interpretation of the Pattern:
This candle indicates seller dominance in the trading market, pushing the price lower during the trading session. Towards the end of the session, a candle appears indicating buyer entry, pushing the price back to the session’s opening level, which then closes at this level, suggesting a potential reversal in direction. The long lower shadow indicates strong buying pressure, while the small or absent upper shadow indicates eager buyers. This pattern is considered a signal for a potential bottom or optimistic reversal towards an uptrend, similar to the Hammer pattern but more reliable, requiring confirmation from the following candle that opens with a bullish gap and closes higher.
4- Homing Pigeon Bullish:
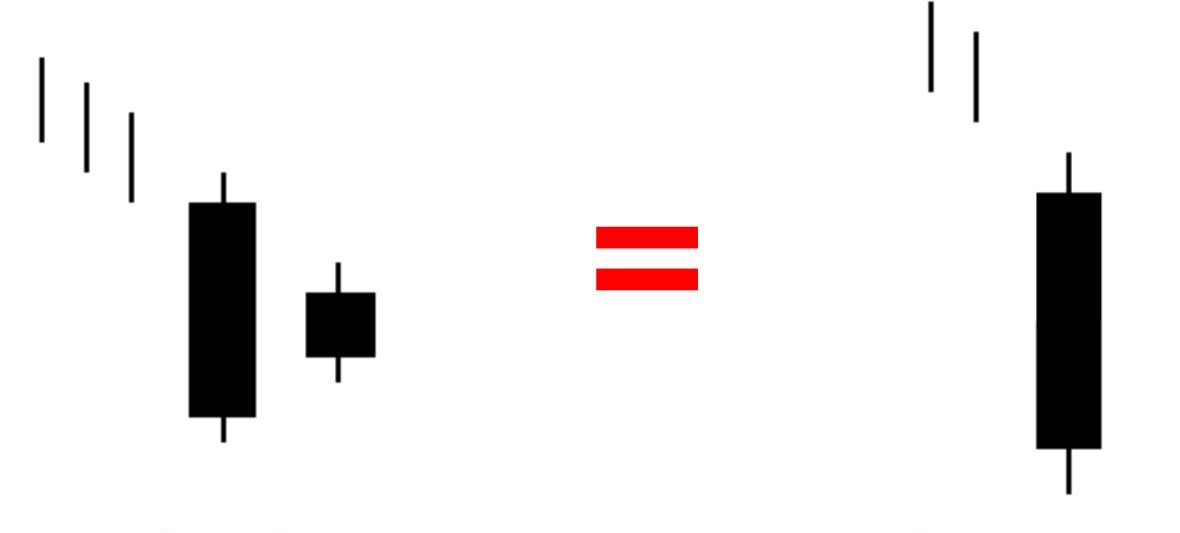
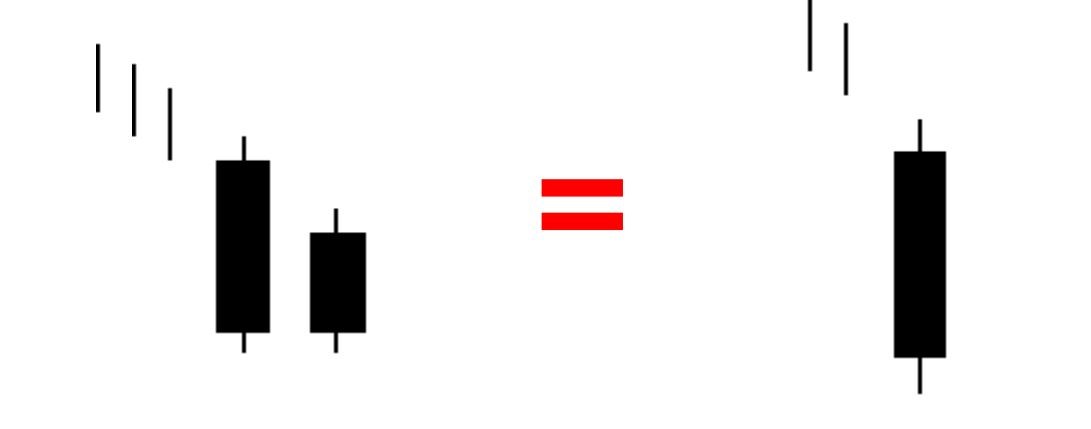
The “Homing Pigeon Bullish” pattern is a Japanese candlestick pattern considered a strong bullish signal in technical analysis, appearing after a period of market decline and indicating a potential reversal towards an uptrend.
Pattern Structure:
The “Homing Pigeon Bullish” pattern consists of the following elements:
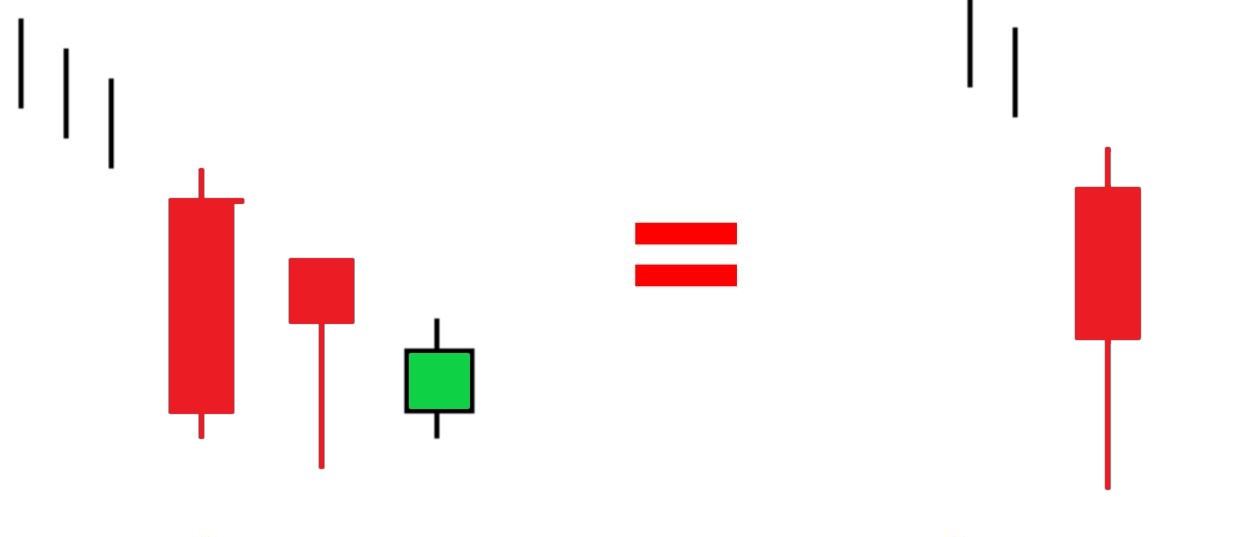
- Two candles: It comprises a long bearish candle followed by a smaller bullish candle that appears within the body range of the preceding bearish candle.
- Relative positioning: The bullish candle is notably positioned within the body of the preceding bearish candle, suggesting a retreat in selling pressure and a potential shift towards buying momentum.
Pattern Characteristics:
- The “Homing Pigeon Bullish” pattern signifies a potential reversal from a downtrend to an uptrend, making it significant for traders looking for reversal signals to enter buy trades.
- The pattern indicates a decline in selling pressure and strength in buyers in the following session, supporting the hypothesis of continued uptrend in the near future.
Pattern Usage:
- Traders use the “Homing Pigeon Bullish” pattern as a signal to enter buy trades once confirmed by the subsequent bullish candle indicating a reversal to an uptrend.
- It is important to confirm the pattern with other technical analysis indicators such as trading volume and relative strength indicators to enhance the signal accuracy.
Practical Example:
Let’s assume the market had been declining for several sessions, then the “Homing Pigeon Bullish” pattern appeared with a small bullish candle inside the body of the previous bearish candle. If the bullish candle closes above the opening level of the bearish candle and shows buying strength, it is considered a positive signal for traders to take a buying position with expectations of further uptrend.
In this way, the “Homing Pigeon Bullish” pattern serves as an effective tool in Japanese candlestick analysis, helping traders identify potential market opportunities and upcoming price trends with precision and effectiveness.
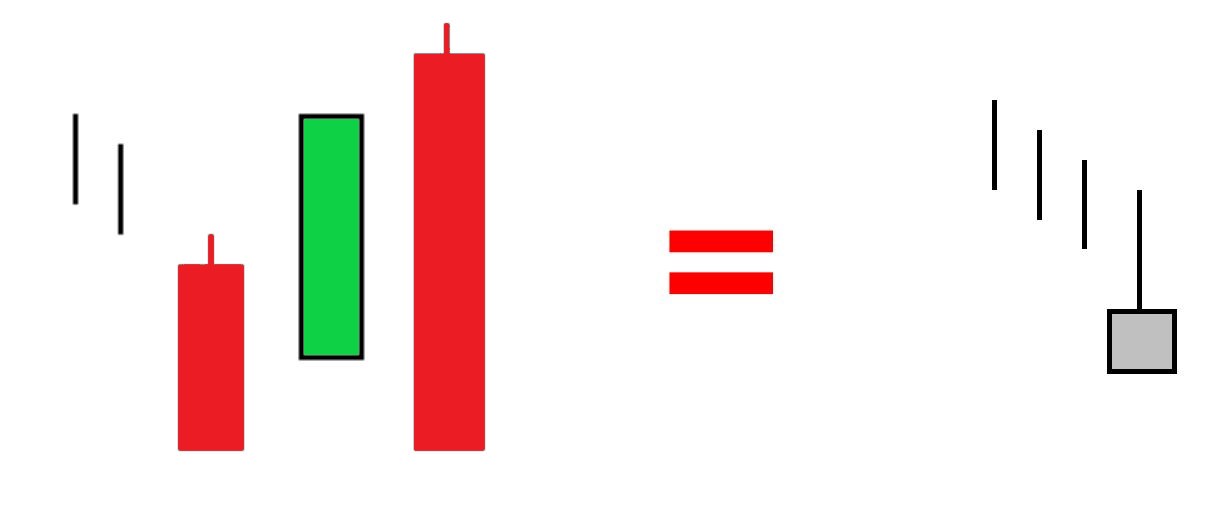
5- Gravestone Doji (INVERTED UMBRELLA) Bullish:
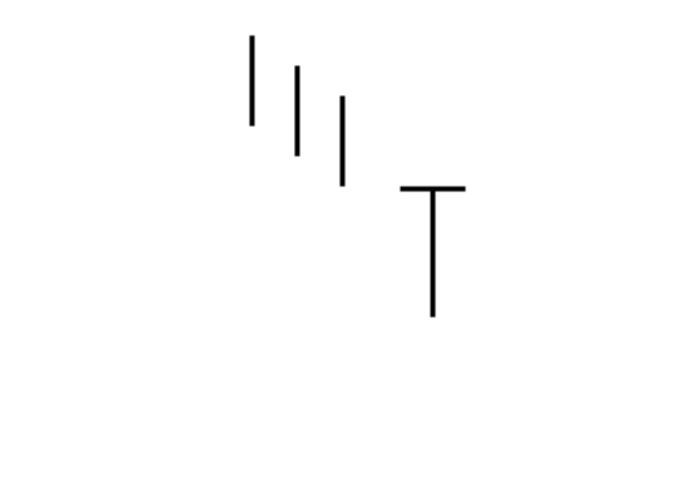
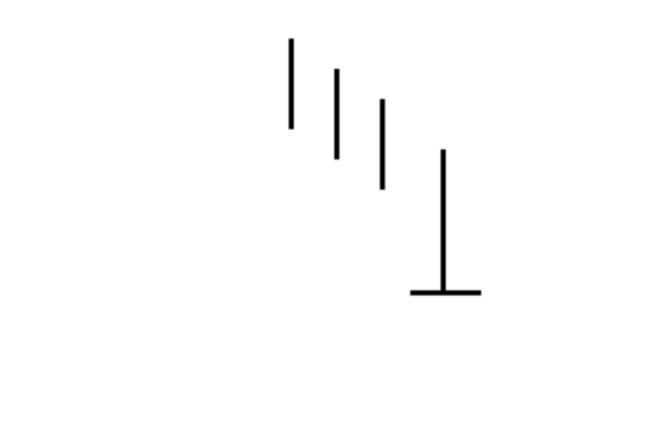
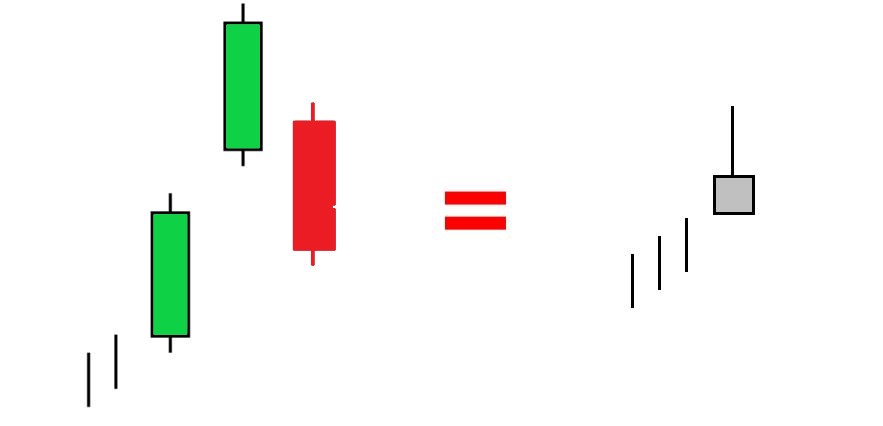
The “Gravestone Doji,” also known as the “Inverted Umbrella Bullish,” is a Japanese candlestick pattern considered a bullish signal in technical analysis. This pattern appears at the end of a downtrend and indicates the possibility of a reversal towards an uptrend.
Pattern Structure:
The “Gravestone Doji” pattern consists of the following elements:
- Body: The candlestick body is very narrow or almost non-existent, reflecting balance between the opening and closing prices.
- Upper Shadow: It is long and extends upwards, indicating that the price moved significantly away from the opening level during the session.
- Absence of Lower Shadow: It is either non-existent or very short, suggesting a lack of strong selling pressure by the end of the session.
Pattern Characteristics:
- The “Gravestone Doji” pattern signifies a potential reversal from a downtrend to an uptrend. The long upper shadow indicates strength among buyers who managed to push the price up towards the session’s highs.
- It reflects a decline in selling pressure and hints at a shift in dynamics favoring buyers, making it important for traders seeking reversal signals to enter buy trades.
Pattern Usage:
- Traders use the “Gravestone Doji” pattern as a signal to enter buy trades once confirmed by the bullish candle that follows the pattern, reinforcing the hypothesis of continued uptrend in the near future.
- Confirmation of the pattern with other technical analysis indicators such as trading volume and relative strength indicators is necessary to ensure signal accuracy.
Practical Example:
Let’s assume the market was in a prolonged decline, then the “Gravestone Doji” pattern appeared, characterized by a long upper shadow and a very narrow body. If the next candle closes above the opening level and shows buying strength, it is considered a strong signal for traders to enter buy positions with expectations of continued upward movement.
In this way, the “Gravestone Doji” pattern is an important and effective tool in Japanese candlestick analysis, helping traders accurately and effectively identify potential market opportunities and future price trends.
Pattern Interpretation:
This candlestick indicates buyer control in the trading market, pushing prices higher during the trading session. By the session’s end, a candle appears indicating seller entry, pushing the price back towards the opening level, with the session ending at its lowest price. Like other technical patterns, this one requires confirmation through previous price action and future confirmation.
The long upper shadow indicates genuine weakness, but the day’s highest price suggests some buying pressure. Following a long downtrend, a long black candle, or a support area, this pattern is a signal of a bottom or a potentially optimistic reversal towards an uptrend.
Similar to the Inverted Hammer pattern, it is more reliable and requires confirmation with a bullish gap and a high close for the following candle as well.
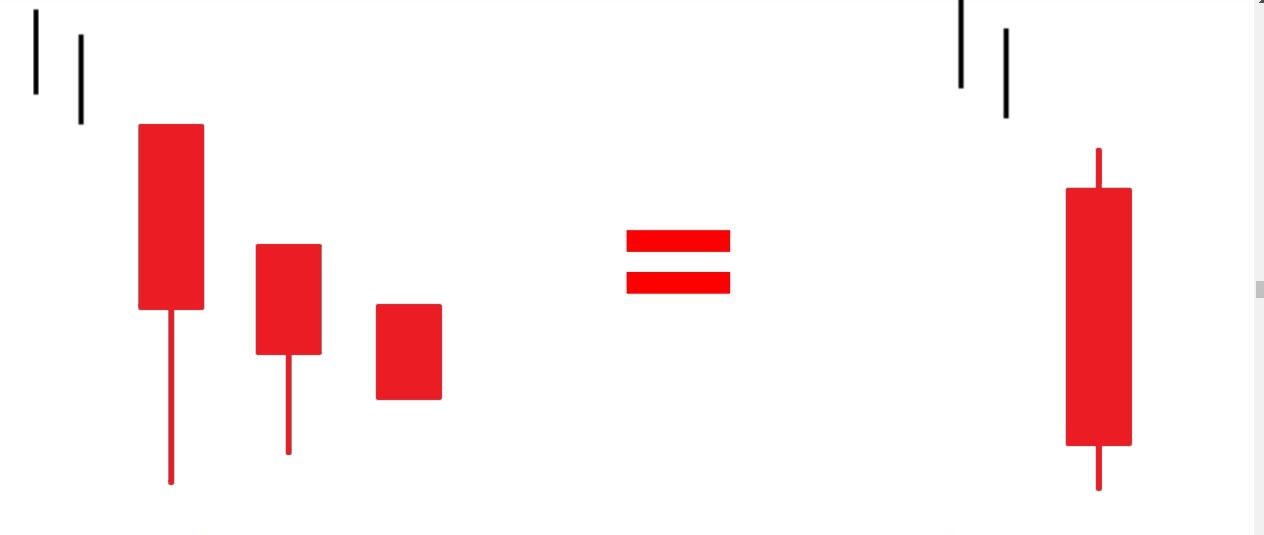
6- Ladder Bottom Bullish:
Pattern “Ladder Bottom Bullish is a Japanese candlestick pattern considered a strong bullish signal in technical analysis, indicating a potential reversal from a downtrend to an uptrend.
Pattern Structure:
The “Ladder Bottom Bullish” pattern typically consists of the following elements:
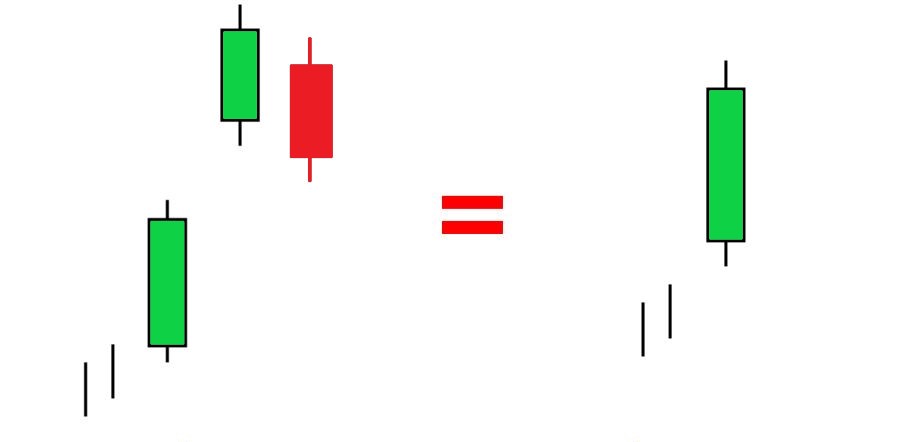
- Candles: The pattern usually comprises a group of ascending candles characterized by long lower shadows and narrow bodies or no bodies, indicating strong demand and weak selling pressure.
- Relative Position: The pattern appears after a period of price decline, suggesting a halt to the downtrend and the beginning of a strong bottom formation.
Pattern Characteristics:
- The “Ladder Bottom Bullish” pattern expresses the possibility of a trend reversal to the upside, with the long lower shadows of the ascending candles indicating successful rebounds from lower levels and buyer control in the market.
- The pattern reflects a shift in market dynamics from negative to positive, making it important for traders seeking strong signals to enter buy positions.
Pattern Usage:
- The “Ladder Bottom Bullish” pattern is used as a signal to enter buy trades once the confirmation of the next ascending candle occurs, reinforcing the hypothesis of continued upward movement in the near future.
- Confirmation of the pattern should be supplemented with other technical analysis indicators such as trading volume and momentum indicators to enhance signal accuracy.
Practical Example:
Let’s assume the market was declining for a period of time, then the “Ladder Bottom Bullish” pattern appeared where prices rebounded after several ascending candles followed by a final candle that exhibited the most strength. If the final ascending candles showed buying strength and closed above the opening level of the last descending candle, it is considered a clear signal to enter a buy trade with expectations of continued upward movement.
In this way, the “Ladder Bottom Bullish” pattern is an important tool in the toolkit of technical analysis, helping traders to accurately and effectively identify potential market opportunities and future price trends.

